Thursday, November 14, 2019

Install Terraform Extension in VS Code for Azure


Install Terraform Extension in VS Code for Azure

Image
MicrosoftLovesTerraform
In the previous article we have gone through with how to install and configure Terraform for azure. 
Refer : INSTALL TERRAFORM FOR AZURE PROVIDER OR WINDOWS 10
Now within this article I’ll be focusing how can we increase productivity after installing certain terraform extension in VSCode.
Step1. Install VSCode from the provided link
Step2: After installing VSCode , open that and search for extension option exist on the left side of screen as depicted below  refer image extension.jpg
VSCode Extension


Once you click on that in search bar type “Terraform”, you will get enough extensions and few of them which I used for my purpose are mentioned below:
Step3: Azure Terraform: The VSCode Azure Terraform extension is designed to increase developer productivity authoring, testing and using Terraform with Azure. The extension provides terraform command support, resource graph visualization and CloudShell integration inside VSCode.
Which allows you to execute following command from VSCode terminal as shown below in screenshot : Refer azure-terraform.jpg
Azure Terraform
Step4:Terraform: Syntax highlighting, linting, formatting, and validation for Hashicorp's Terraform.

Step5:Terraform: its by Anton Kulikov ,This is visual studio code extension ,adds syntax support for the terraform configuration language.


Once you have installed all of them and see the structure of your files it will have pretty impressive icon on the left side and intellisense will start working as shown below in screen shots.
Refer an images  icon.jpg and intellisense.jpg respectively.


I believe an article will help you to start with terraform with VSCode.
In the upcoming article we’ll learn how can we create Service Principal in Azure to start with Terraform authentication.


Monday, November 11, 2019

Install Terraform for Azure Provider or Windows 10


Install Terraform for Azure Provider or on Windows 10


Terraform has been well known open-source infrastructure as code software tool created by HashiCorp , which enables users to define and provision a datacenter infrastructure using a high-level configuration language known as Hashicorp Configuration Language, or optionally JSON.
To install Terraform on windows 10 machine there are some simple steps you have to proceed with to get it done.

In the following article we will be focused around that.
Kindly open the following link in you browser and go to bottom to download it for windows https://www.terraform.io/downloads.html
Though there will be various option available , but you choose an option to go with Windows 64 bit for windows 10.


Once you have download that (in my case: terraform_0.12.13_windows_amd64)
Just extract that and place in your desired drive like I have put it in C drive as shown below:


Windows 10 and Windows 8
1.     Go to Control Panel
2.     Click the Advanced system settings link or Search Advanced system settings in search. Refer advance-settings.jpg
3.     Click on Environment Variables  In the section System Variables, find the PATH environment variable and select it. After that click on Edit and enter the value as shown in image env_varibale.jpg
4.     In the Edit System Variable (or New System Variable) window, specify the value of the PATH environment variable. Click OK. Close all remaining windows by clicking OK.

img-advance-settings.jpg

 img env_varibale.jpg


Now you are done with the environment path setup, now open PowerShell command window to verify about the terraform version.
Kindly type the following command to verify that: terraform -version
Refer an image below powershell_terraform.jpg


We are done with an installation, now in upcoming articles we will understand how Terraform works with Azure provider and how can we authenticate azure resource provide to create azure resources.


Tuesday, October 8, 2019

Create and Share Metrics Dashboard in Azure


Create and Share Metrics Dashboard in Azure

Image result for azure metrics icon

You can create & share Azure Portal dashboard to other users or group with having access to the same Azure Subscription. Azure allows you to create  your required dashboards such as metrics for azure service & Azure service health dashboard, or any other Azure services monitoring dashboard , so that we could keep track of what is happening in our services . you can share dashboard with other in case they need same. In this post let’s have a quick look at how we can share a dashboard and give necessary access to users.
Create Azure Portal Dashboard
To understand how can we create a new, private dashboard and assign a name. Follow these steps to get started:
1.    Sign in to the Azure portal.
2.    Select Dashboard from the upper section of the left sidebar. Your default view might already be set to dashboard.
3.    Select + New dashboard.


For my demo I have AppService which is up and running and here I’ll be creating a dashboard to monitor an AppService running status.

Kindly go to AppService and find “metrics” there as depicted in given below screenshot app-metrics


From the metric dropdown I have selected CPU runtime to see the CPU utilization of an application and click on pin to dashboard.
Once you click on “Pin to dashboard”  there will be an another option “select another dashboard” to pin it. As shown in below screen shot select-another-dashboard.


 Once you click on that a new window will appear on the right , fill the required details to create new dashboard within the subscription , you can choose another subscription as per your need and click apply. After few seconds dashboard will have created and a link will be there at bottom of screen to jump directly to dashboard
Refer a screen shot depicted below : create-new-dashboard.


After clicking on Monitor AppService , it will open the dashboard ,where you should be able to see the CPU metrics board, point to notice is it has shared already once you create that, you will be able to see the Unshare button on top of the screen.  as shown in image below : unshare-dashboard


The same way you can create few more metrics into existing dashboard.
You can also see all dashboard from the search as well by typing shared dashboard ,it will show you each shared dashboard within subscription.
Refer- shared-dashboard


I wish it will help you to create Shared Dashboard, in coming Article will explain you how can we place RBAC policy on dashboard.


Thursday, September 26, 2019

Integrate an Azure Alert with action group in Availability Test  in Azure

This is really interesting to implement to check an availability of you webapp/AppService . Azure leverage you to do this. You can set up recurring tests to monitor an availability on intervals from difference geographical point around the world.
An Important factor is , it can raise an alert on that basis if certain condition doesn’t meet.

An excerpt from doc.microsoft.com

Types of availability tests:
There are three types of availability tests:
·         URL ping test: a simple test that you can create in the Azure portal.
·         Multi-step web test: A recording of a sequence of web requests, which can be played back to test more complex scenarios. Multi-step web tests are created in Visual Studio Enterprise and uploaded to the portal for execution.
·         Custom Track Availability Tests: The TrackAvailability() method can be used to create your own custom availability tests.


NOTE: You can create up to 100 availability tests per Application Insights resource.

Prerequisites: Application Insights resource

In order to create Test , first create an application insight for the specific resource. I assume you understand how to create an application insight for AppService.

As soon as you have created Application Insight, its time to create a availability test case in azure using Azure Portal.

You can see an application insight option in AppService left pane as depicted in image app-insights


Click on that and it will take you on the following screen as shown below screen view-app-insights


Click on View Application Insights data and proceed further to see detailed application insights refer screen  below detailed-app-insight


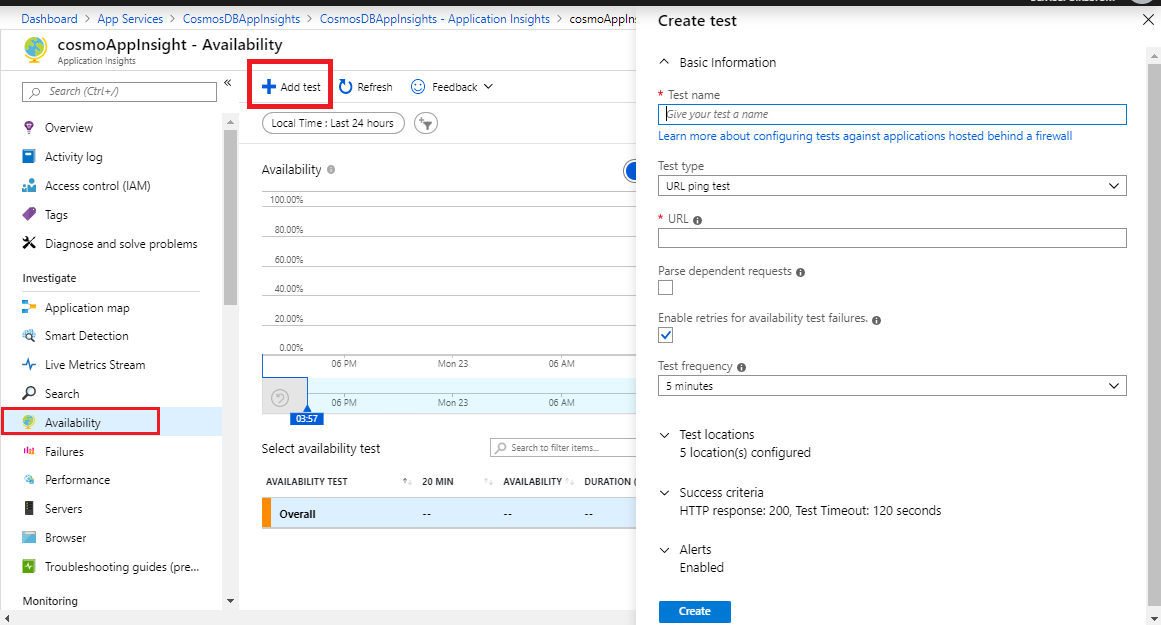
Kindly find Availability option on the left panel of screen and click , once you click it will open a screen to create Add Test . Fill the required details of your endpoint to verify its availability from different geography. Refer screen add-test


Refer an image below to understand what value we should fill for the respective fields which appears on the screen. Add-test-complete-details


Each field is self explanatory though there are few which may be bit confusing so follow the below excerpt:

Parse dependent requests : When enabled, the test requests images, scripts, style files, and other files that are part of the web page under test. The recorded response time includes the time taken to get these files. The test fails if all these resources cannot be successfully downloaded within the timeout for the whole test. If this option is not enabled, the test only requests the file at the URL you specified.

Enable retries for availability test failures : If the test fails, we’ll try it again after 20 seconds. We’ll record a failure only if it fails three times in a row.


Success criteria


Setting
Explanation
Test timeout
Decrease this value to be alerted about slow responses. The test is counted as a failure if the responses from your site have not been received within this period. If you selected Parse dependent requests, then all the images, style files, scripts, and other dependent resources must have been received within this period.
HTTP response
The returned status code that is counted as a success. 200 is the code that indicates that a normal web page has been returned.
Content match
A string, like "Welcome!" We test that an exact case-sensitive match occurs in every response. It must be a plain string, without wildcards. Don't forget that if your page content changes you might have to update it. Only English characters are supported with content match

Availability test results

Test results can be seen in form of Scatter plot and Line views, After a few mins click refresh your test results.

It appears with the following details refer screen availability-test-successful.


Edit an Alert in Availability test

Azure allows you to integrate an alert with a ping test for AppService , To achieve that just click on “…” and edit alert , a new window will appear where you can set your alert mechanism to get a notification. Refer edit-alert screen shot below:


Enable it and select an action group or create an action g
roup.
To create an action group refer this page .
In short action group is collection of different notifications or intimation to group of members, Action group takes an anticipated action to resolve issue for an alert already raised .Refer a screen shot action-group as shown below.


After choosing desired action group than save an alert. Each alert specifies a condition like  Whenever the Failed locations is Greater than or equal to 2 count
If an above condition doesn’t meet while availability test it triggers an alert to send a notification to Action Group.


I hope it will help you to manage alerting system in Availability Test case.


To edit, temporarily disable, or delete a test click the ellipses next to a test name. It may take up to 20 minutes for configuration changes to propagate to all test agents after a change is made.

I hope it will help you while you create Test case for your application. 

Saturday, August 3, 2019


Azure App Insights – Write Test case for AppService Availability


To check you AppService availability is potential when your application is in production and being use by plenty of end users. To write test case in .Net, Java or in other programming language is possible using Nunit ,Junit ,Jasmine and others.
I was astonished with this testing feature, So thought to explore something about it. Yeahh That’s true so lets write Test case in Azure .Trust me it gonna be fun.
I’m utilizing .Net Core based application along with Azure Cosmos DB.


Prerequisites : You should have basic understanding of .Net Core .
Application Insights should be configured for an application like WebApp/AppService
Once you are done, You can should see few resources created within Azure portal as shown in image rg-in-azure


Once you have published an application ,Click on Application Insights (e.g. CosmosDBInsights).After clicking on this it opens AppInsights refer an image shown below application-insights


IN the left pane you should be able to see Availability option till date 3Aug 2019 ,Click on that
After clicking of availability you will see the following screen in order to create you Test to verify an availability of the specific endpoint. Refer image add-test


After clicking on AddTest , A new window will appear on the right side to fill the all necessary details like


  1. TestName,
  2. Test Type
  3.  Specify the URL to test in that,
  4.  Parse dependent request which states “When enabled, the test requests images, scripts, style files, and other files that are part of the web page under test. The recorded response time includes the time taken to get these files. The test fails if all these resources cannot be successfully downloaded within the timeout for the whole test. If this option is not enabled, the test only requests the file at the URL you specified” . Reference portal.azure.com.
  5. . Enable retries for availability test failures
  6.  Test Frequency : The frequency at which this test will be executed periodically.
  7.  Test Location : Choose your test location after keeping thought about users .
  8.  Success Criteria Which requires Http status code returned to equal the value like 200, 400,4040, 500 etc.
  9.  Alerts : There are default alerts configured though classis preview still exists.

You can refer below some screen shots for reference what should you fill in those properties.
Refer image Test-case-details


Once you save it and after the certain time you will see , Test case has started executing and you should be able to see the details in Availability section in form of line chart or Scatter chart. If you expand the arrow button shows below the chart you will find location details about website availability .Kindy refer an image showing below: availability-of-ping-url


This helps you definitely if you want to test specific endpoint availability.